How
这个功能用到的是 curl 的 -w 选项,让我们来先看看 curl 的 man page:
| |
下面的内容就是各种内置变量了,我们可以通过这些变量的值来一窥请求的真实信息。
以下有一个“广为流传”的格式:
将如上内容写至 curl-format 文件中,然后在当前目录运行:
| |
-w @curl-format:使用curl-format文件模板进行输出。
-o /dev/null:忽略输出内容。
-s:不输出多余信息。
-L:支持跳转(如 HTTP 跳转至 HTTPS)。
就会看到像这样的输出:
这些变量的意义是:
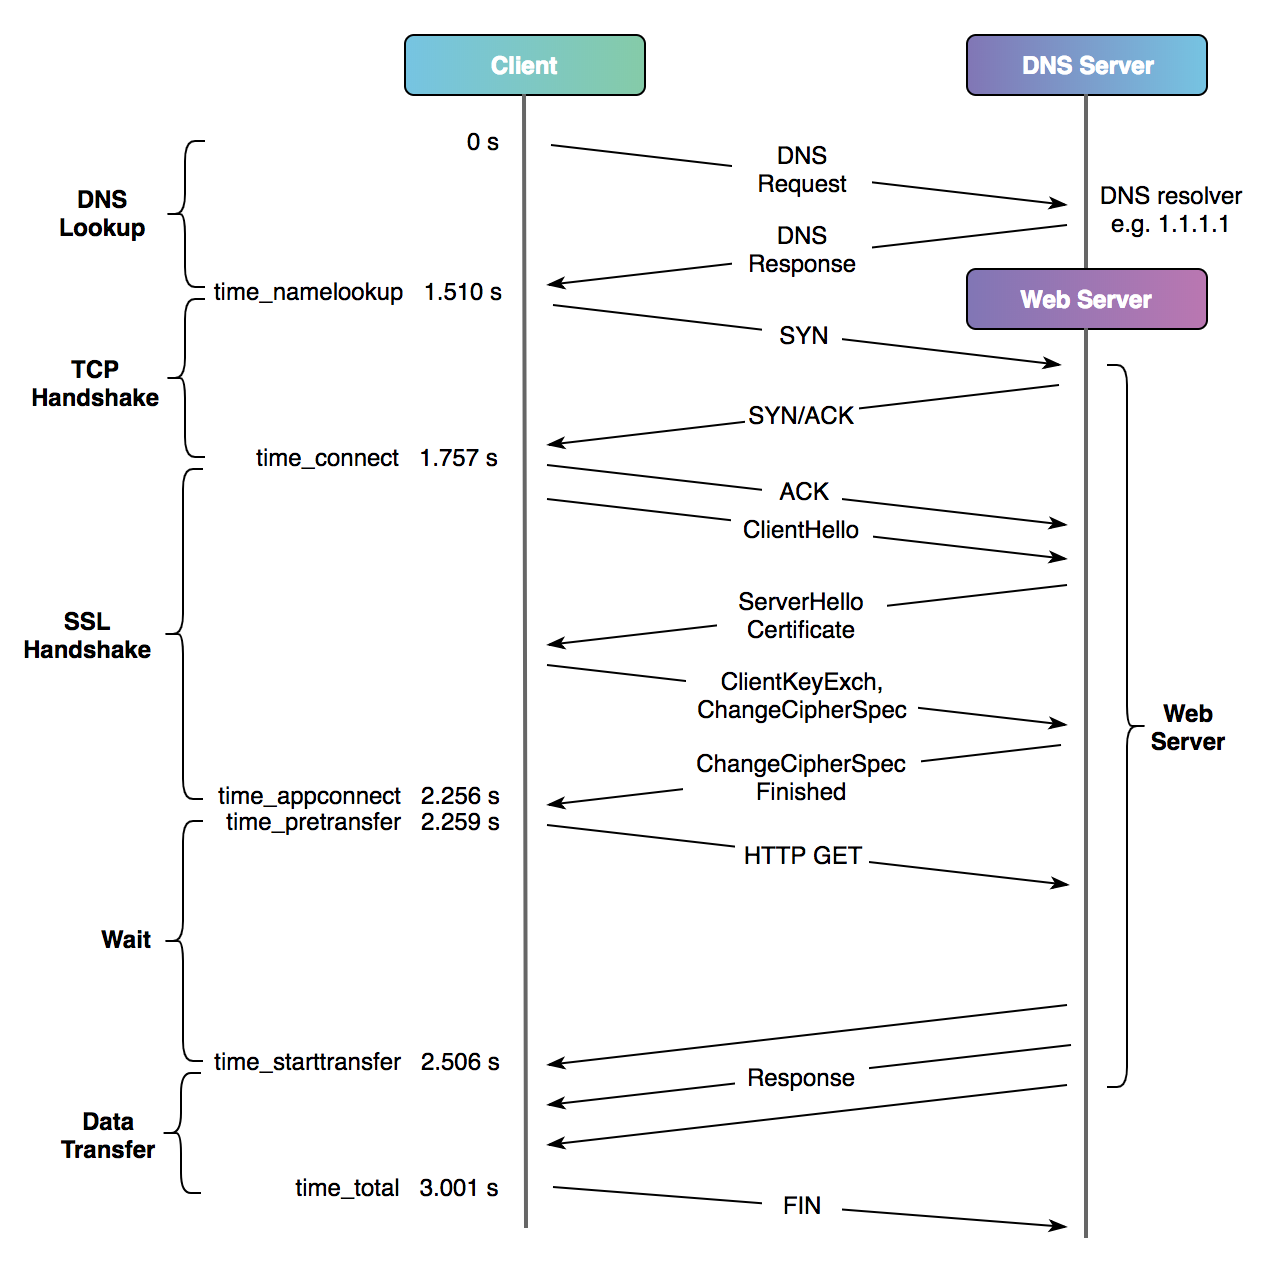
time_namelookup:(从请求开始到)DNS 域名解析的耗时。time_connect:(从请求开始到)TCP 连接建立耗时。time_appconnect:(从请求开始到)SSL/SSH 等上层协议建立连接的耗时,比如 connect/handshake 耗时(从此处也可看出,最后还是请求了https://triplez.cn,否则 HTTP 不会产生time_appconnect的耗时。time_redirect:(从请求开始到)最后一个请求事务的耗时。time_pretransfer:(从请求开始到)响应开始传输的耗时。time_starttransfer:(从请求开始到)第一个字节将要传输的耗时。time_total:这次请求的总耗时。
time_*这些变量代表的是到某个阶段结束后计时器的值,并不是某个阶段的耗时。若希望获得某个阶段的耗时,需要使用
time_*变量值进行作差,可用 @will 在此文中提供的脚本 来实现。使用 curl 来获取各阶段耗时的脚本
1 2 3 4 5 6 7 8 9 10 11 12 13 14 15 16 17 18 19 20 21 22 23 24 25 26 27 28 29 30 31 32 33 34 35 36 37 38 39 40 41 42 43 44 45 46 47 48 49 50 51 52 53#!/bin/bash #author : will #website: https://www.nixops.me Default_URL=https://www.nixops.me URL=${1:-$Default_URL} Result=`curl -o /dev/null -s $URL \ -w \ 'time_namelookup=%{time_namelookup} time_connect=%{time_connect} time_appconnect=%{time_appconnect} time_redirect=%{time_redirect} time_pretransfer=%{time_pretransfer} time_starttransfer=%{time_starttransfer} time_total=%{time_total} '` declare $Result curl_timing(){ printf "\e[92mcURL Timing: \e[0m\n" for i in $Result do IFS='=' printf "\e[96m%18s \e[0m: %10s \n" $i done } stat_timing(){ Result_TCP=`printf "%.6f" $(echo $time_connect - $time_namelookup |bc -l)` Result_TLS=`printf "%.6f" $(echo $time_appconnect - $time_connect |bc -l)` Result_Server=`printf "%.6f" $(echo $time_starttransfer - $time_pretransfer |bc -l)` Result_TTFB=`printf "%.6f" $(echo $time_starttransfer - $time_appconnect |bc -l)` Result_Transfer=`printf "%.6f" $(echo $time_total - $time_starttransfer |bc -l)` printf "\n\e[92mResource Timing: \e[0m\n" printf "\e[96m%18s \e[0m: %.6f \n" "DNS Lookup" $time_namelookup printf "\e[96m%18s \e[0m: %.6f \n" "TCP Connection" $Result_TCP if [ `echo "$time_appconnect == 0"|bc` -eq 0 ] then printf "\e[96m%18s \e[0m: %.6f \n" "TLS Handshake" $Result_TLS fi printf "\e[96m%18s \e[0m: %.6f \n" "Server Processing" $Result_Server printf "\e[96m%18s \e[0m: %.6f \n" "TTFB" $Result_TTFB printf "\e[96m%18s \e[0m: %.6f \n" "Content Transfer" $Result_Transfer printf "\e[96m%18s \e[0m: %.6f \n" "Finish" $time_total } curl_timing stat_timing
除此之外,还可用 Cloudflare 在 此篇博文 中提供的图表来简化理解。
One more thing…
reorx 写了个 Python 的小工具 httpstat,让命令行分析请求耗时更加直观。通过以下命令即可安装:
| |
让我们来试一下:
| |
从输出上我们就可以很直观地看出来,从 http://triplez.cn 到 https://triplez.cn 中完成了一次 302 跳转,在输出末尾的示意图上我们也可以清楚地看到各阶段的耗时。
Happy hacking :)
References

本作品采用知识共享署名-相同方式共享 4.0 国际许可协议进行许可。